
Tour Operator Reports and Analytics: Decide With Data
You know the business is doing "okay" but cannot say which tours earn the most, which agents convert best or whether margins are holding. Here is what a tour operator should measure and how reports replace gut feel.
Travify Team
Travel Operations Experts · April 13, 2026 · Updated October 6, 2026
In short: Reports and analytics let a tour operator answer the questions that decide profit: which tours earn the most margin, which travel agents convert, which hotels are worth negotiating with, and whether revenue is growing faster than costs. The data should come from normal bookings, costings, vouchers and invoices, reviewed weekly, monthly and quarterly, with no extra data entry.
Ask most Sri Lankan DMC owners how the business is performing and you get a general answer: "busier than last year" or "margins are tight". Ask which tours are most profitable, which agents convert best, or how this quarter compares with the same period last year, and the answer is usually "I would need to check".
A DMC (destination management company) is the inbound tour operator that costs, books and operates the trip on the ground. "Checking" means opening spreadsheets, counting bookings by hand and cross-referencing payment records, so most operators run on intuition instead. That works while the business is small. It becomes dangerous as volumes grow, margins tighten and competitors move faster.
Key takeaways
- Every tour operator should be able to answer ten core questions, from revenue this quarter to profit margin per tour, without opening a spreadsheet.
- Six report areas cover the whole business: overview, bookings, hotels, travel agents, financial and customers.
- Planned markup is not profit; only a settlement that compares revenue with actual costs shows the true margin of a tour.
- A weekly, monthly, quarterly and annual review cadence turns reports into decisions instead of unread charts.
- Analytics should be a by-product of running bookings, costings, vouchers and invoices in one system, not a separate data-entry job.
In a market targeting 3 million arrivals in 2026, the Sri Lankan DMCs that know exactly where their money comes from, where it goes and what is working will hold a decisive edge over those still relying on gut feel.
Which questions should a tour operator be able to answer instantly?
A tour operator should be able to answer the ten questions below in under a minute, without digging through files. They cover revenue, pipeline, suppliers, agents, margins and customers, and together they describe the health of the business.
- What is total revenue this month, this quarter and this year?
- How many bookings sit in each status: inquiry, confirmed, paid, in progress and completed?
- What is the conversion rate from inquiry to confirmed booking?
- Which tours generate the most bookings and the most revenue?
- Which travel agents send the most bookings, and which generate the highest revenue?
- What are the actual profit margins after all costs, not just the planned markup?
- Which hotels are used the most, and what revenue do they generate?
- Is the customer base growing month over month?
- What percentage of bookings come from repeat customers?
- What is the average booking value, and is it trending up or down?
If most of these need a long pause, the business is running on incomplete information. The usual symptoms are time invested in agents who send low-value bookings, promotion of tours with thin margins, and customer acquisition that plateaued while everyone was busy with operational firefighting.
Running a growing DMC without analytics is driving at night with the headlights off. Experience keeps you mostly on the road, but one unexpected curve, a market shift, a key agent leaving or a cost overrun on your most popular tour, arrives with no data to guide the response.
What are the six report areas every DMC needs?
Six report areas cover a tour operation end to end: overview, bookings, hotels, travel agents, financial and customers. Each answers a distinct set of questions, and each is explained below with the decision it supports.
1. Overview: the executive dashboard
The overview answers "how is the business doing right now?" with total revenue, booking count, average booking value and the revenue trend over time. The single most useful element is the booking funnel, which shows the conversion rate at each stage.
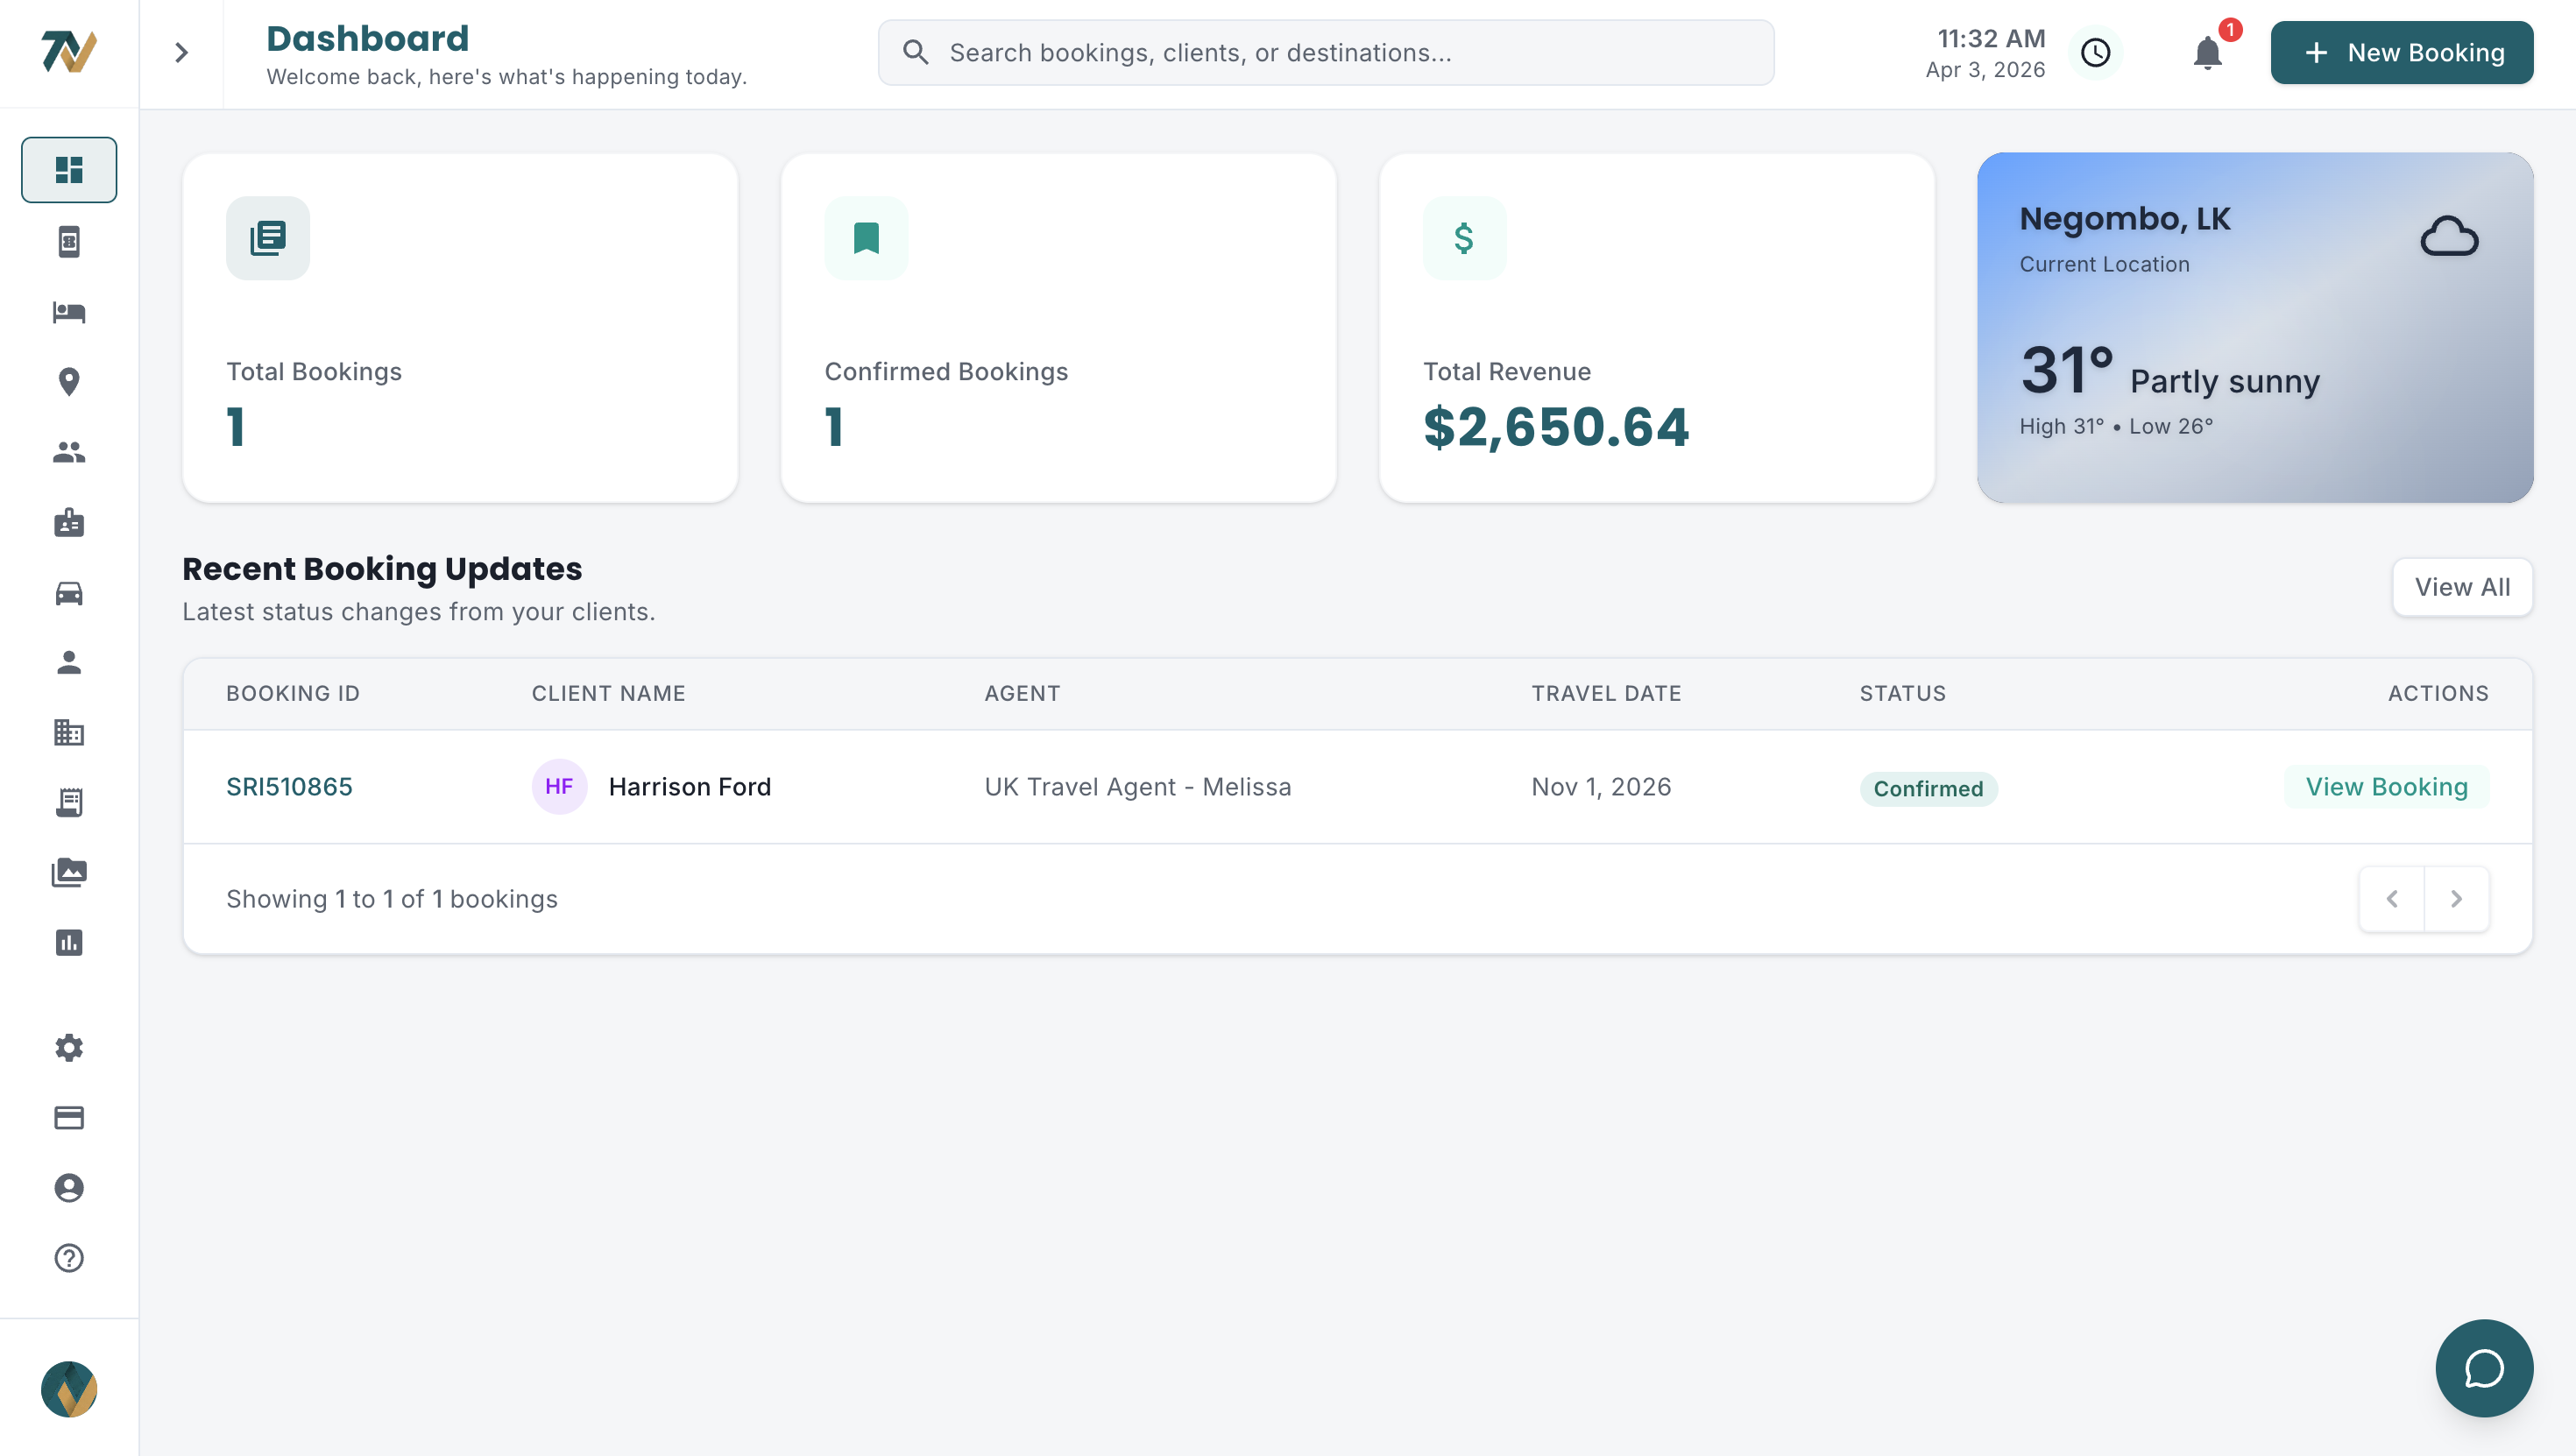
The funnel shows how many inquiries arrived, how many were confirmed and how many were completed, with the conversion rate between stages. Plenty of inquiries but few confirmations points to the quotation process: reply speed, pricing or quality. Strong confirmation rates but low inquiry volume points to agent relationships or marketing.
The table below describes each funnel stage qualitatively. Healthy ranges differ by market, season and tour type, so compare against your own history rather than a universal number.
| Funnel stage | What it measures | Healthy pattern | Warning sign |
|---|---|---|---|
| Inquiry to quoted | Share of inquiries that receive a quotation | Nearly every inquiry gets a quote the same day | A growing share of inquiries never receive a quotation, usually because they were missed or deprioritised |
| Quoted to confirmed | Quotation win rate | A stable or rising win rate in each market | A falling win rate, which usually signals pricing or response-time problems |
| Confirmed to completed | Fulfilment rate | Very few confirmed bookings cancel | Rising cancellations, which point to operational or payment-collection issues |
| Overall conversion | End-to-end pipeline efficiency | Improving quarter on quarter | A shrinking share of inquiries reaching completion means the pipeline is leaking somewhere |
2. Bookings: reading the pipeline
Booking reports show the pipeline in detail: how many bookings sit in each status today, whether creation volume is growing or declining, which tours sell most often and where the pipeline narrows between statuses.
This is the data for capacity planning. Rising booking creation means the team, suppliers and guide network must be ready to absorb the volume before the December to March peak. A tour that consistently tops the list deserves refined costings, polished itinerary documents and secured hotel allocations.
3. Hotels: negotiating with evidence
Hotel reports show utilisation, revenue per hotel and nights booked across your property partners, which turns rate negotiations from guesswork into data-backed conversations.
When you can show a hotel, as an illustrative example, that you sent it 85 room nights last quarter, you negotiate from strength. Knowing which properties earn the most per night tells you where to secure better rates and allocations. A once-popular hotel that is losing utilisation raises a question worth asking: have its rates become uncompetitive, has quality dropped, or is the team simply defaulting elsewhere?
Pair these reports with disciplined hotel rate management so the rates you negotiate actually reach the costing team.
Each quarter, list your top hotels by revenue and your least-used hotels. For the top group, negotiate better rates or exclusive allocations with the numbers in hand. For the least-used group, decide whether the relationship is worth keeping or should be deprioritised.
4. Travel agents: investing in the right relationships
Agent reports are the most strategically important area for a B2B tour operator, one that sells through travel agents abroad rather than directly to travellers. They compare bookings, revenue and commission per agent and rank the whole network.
Most DMCs treat every agent equally and answer inquiries in arrival order. The data almost always shows a Pareto pattern: a small share of agents generates most of the revenue. Knowing who they are lets you prioritise their inquiries, offer preferential terms and give them the fastest service. Our guide to B2B agent management covers how to structure those relationships.
Agent reports also expose weak relationships. An agent who sends many inquiries but rarely confirms may not justify the quotation time consumed. An agent who books consistently at very low values may need a different pricing structure. Neither decision can be made confidently without data.
| Agent pattern | What it tells you | Action to take |
|---|---|---|
| High bookings, high revenue | Your best partner: protect this relationship | Priority response, a dedicated account manager, preferred rates |
| High inquiries, low conversion | Either your pricing does not match their market or they shop around | Review pricing for their segment, discuss expectations, improve response speed |
| Low volume, high value per booking | A niche or luxury agent sending quality over quantity | Maintain the relationship, offer premium itinerary support |
| Declining bookings over time | The agent may be shifting to a competitor or their business is changing | Proactive outreach, ask for feedback, offer incentives |
| New agent with growing bookings | An emerging partnership with potential | Invest early, deliver excellent service, build loyalty before competitors notice |
5. Financial: protecting margins
Financial reports show whether the business is healthy or merely busy: revenue trend, cost analysis, profit margin per tour, settlement status and a month-by-month breakdown.
Revenue growth without margin visibility is meaningless. The busiest DMC in Colombo can still lose money if costs are not controlled. Financial reports should answer:
- Revenue trend: is revenue growing, and is it growing faster than costs?
- Margin by tour: which itineraries make money and which barely break even?
- Settlement status: which completed bookings are fully settled, and which still have supplier payables or agent receivables open? A settlement is the post-trip reconciliation of revenue against actual costs and payments.
- Monthly breakdown: how does each month compare with plan and with the same month last year?
- Cost analysis: where does the money go, and is any cost category growing disproportionately?
A DMC's first real margin review commonly uncovers tours that are less profitable than everyone assumed. The fix is usually simple, a rate update, a markup adjustment or a supplier renegotiation, but without the data the problem stays invisible for months. See what costing errors really cost.
6. Customers: building long-term value
Customer reports track acquisition trend, repeat rate and customer base growth. Most DMC attention goes to agents and bookings, yet the end-customer base reveals long-term opportunities that transactional thinking misses.
Repeat rate is the most telling metric. A healthy DMC sees a growing share of bookings from returning travellers or their referrals. A persistently low repeat rate suggests the trip was adequate but not memorable. A high one is an asset to nurture with post-trip follow-ups, review requests and return-visit offers.
Customer lifetime value, the total revenue a customer generates across all their bookings, identifies the relationships worth the most. As an illustrative example, a family that has booked three Sri Lanka trips over five years is worth more than a larger one-off booking, and deserves to be treated that way.
How do you turn reports into decisions?
Reports create value only when someone acts on them on a fixed cadence. Charts nobody opens are worse than no reports, because they create a false sense of data-driven management. This cadence works for a small or mid-sized DMC:
- Weekly: check overview metrics (bookings, revenue, conversion rate) to confirm the business is on track. This takes a few minutes and catches problems early.
- Monthly: review agent performance, hotel utilisation and financial margins. Identify the top and bottom performers in each and set one specific improvement goal.
- Quarterly: go through all six report areas. Compare with the previous quarter and the same quarter last year, then update pricing, agent priorities and hotel partnerships accordingly.
- Annually: run a full-year review. Set next year's targets from the trends, identify market shifts and plan investment where the return is highest.
Tour revenue and costs belong to the month the group travels, not the month the booking was created. Judging a month by the bookings created in it mixes next season's deposits with this month's operations. Group the profit and loss by departure month and compare it with the same month last year.
What does running a DMC without analytics cost?
Decisions made without data cost real money: lost revenue, wasted time, missed opportunities and eroding margins. These are the typical patterns:
- Spending equal time on every agent while a handful of agents generate most of the revenue
- Promoting the "most popular" tour on perception, then discovering it carries the lowest margin in the portfolio
- Maintaining dozens of hotel partnerships when several properties have not been used for months
- Pricing on last year's costs while actual costs have crept up and selling prices stayed flat
- Believing the business is growing because revenue is up, without seeing that the growth is entirely in low-margin bookings
- Missing a key agent's three-month booking decline until they have already moved to a competitor
The cumulative cost of these decisions far exceeds the cost of analytics, which for a tour operator should be a by-product of the operations software already in daily use.
How do you get started with analytics without a data team?
A DMC does not need a data scientist, a BI tool or a dedicated analyst. The analytics it needs should be generated automatically from the booking, costing, voucher and invoice data already entered during normal work. Build the habit in four steps:
- Check the overview once a week. Get comfortable with the booking funnel and the revenue trend.
- After two or three weeks, add agent performance. Identify your top agents by revenue and make sure they receive your best service.
- After a month, review the financial reports. Compare actual margins with what you assumed and look for tours where the margin differs sharply from the planned markup.
- After a quarter, you have enough data for trend analysis. Compare months, identify seasonal patterns and set next quarter's targets from actual numbers rather than hope.
Analytics maturity is progressive. Start with overview metrics, expand to the areas tied to your immediate challenges and build data literacy over time, as described in our guide to scaling a tour operation.
How Travify turns operational data into reports
Travify generates reports from the data a team already enters while running bookings, costings, vouchers, invoices and settlements, so there is no separate data-entry step. In practice, a Sri Lankan DMC on Travify gets:
- A Reports area with Overview, Bookings, Hotels, Agents, Financial and Customers views, filtered by date range presets such as This Month, Last 3 Months and This Year or a custom range; chart granularity adjusts automatically to the range, daily for short ranges and monthly for longer ones.
- An Agents view comparing bookings per agent, revenue generated and estimated commission, with an agent ranking, and a Customers view with acquisition trend, repeat rate and a Top Customers by Spend list showing each customer's total spend across all their bookings and booking count.
- Financial reports with monthly P&L by departure month, margin by market, agent and designer, cash in versus cash out, aging and settlement turnaround.
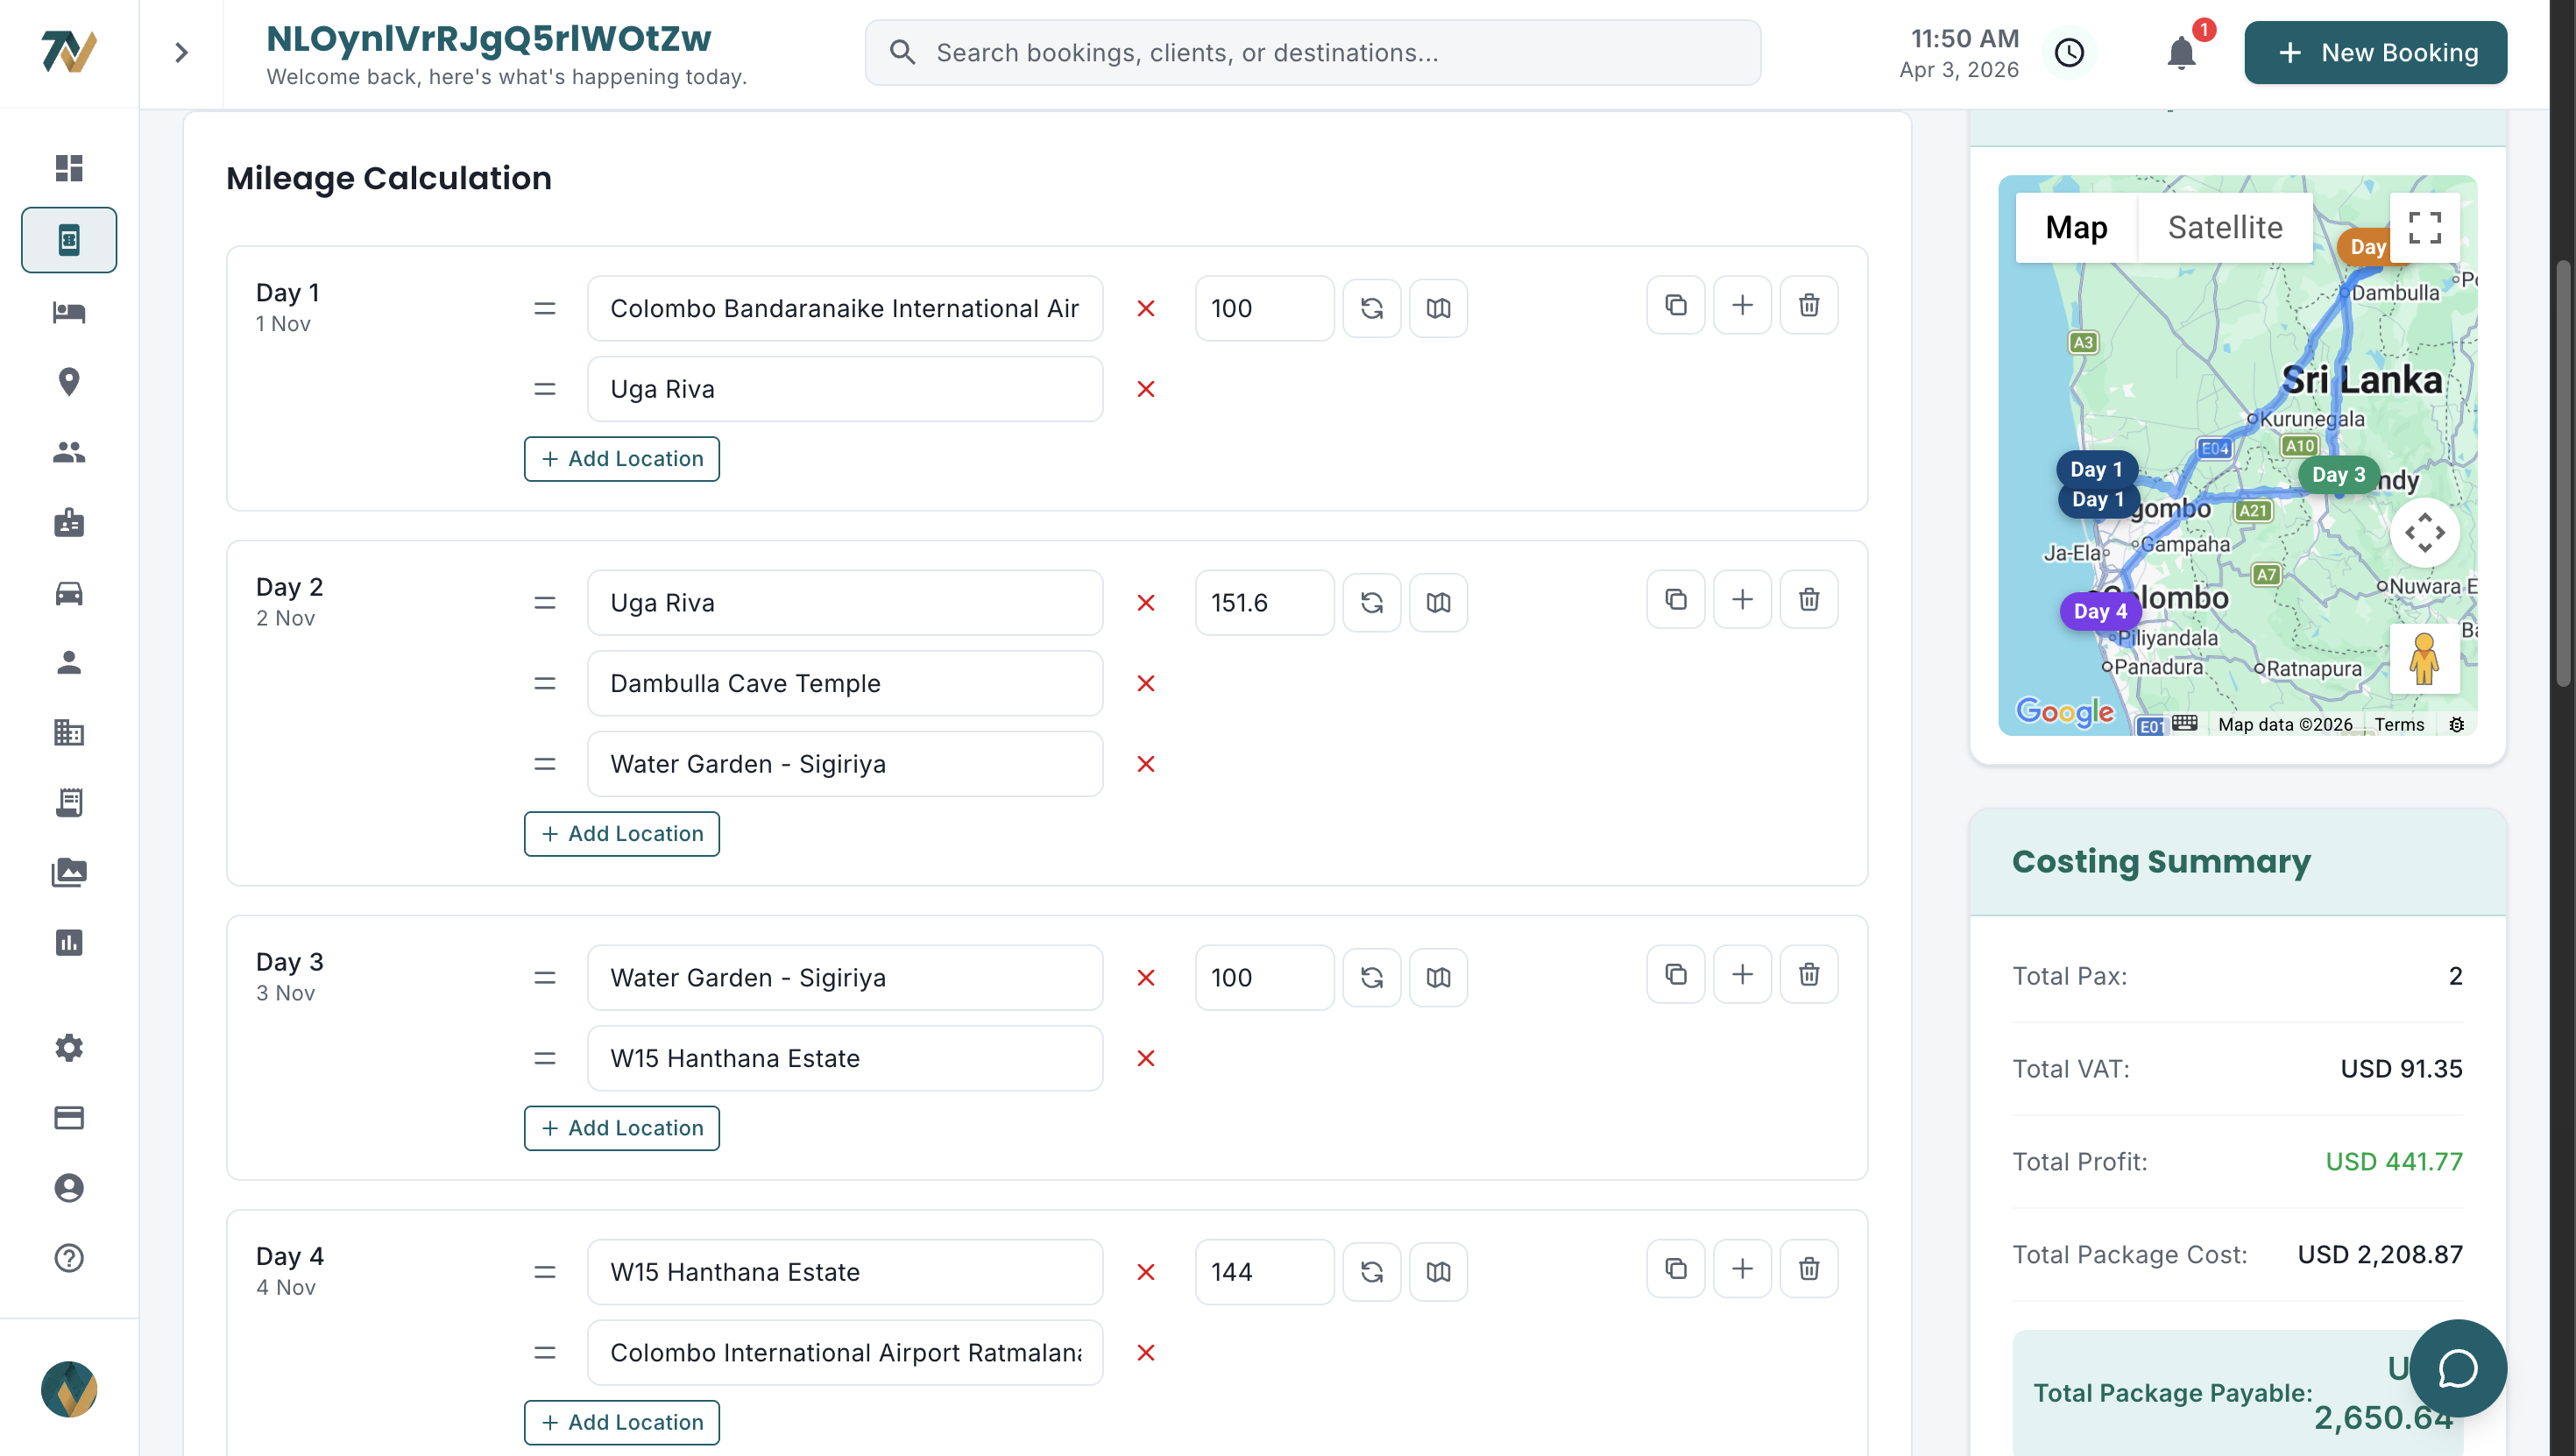
- A settlement created automatically when a booking is marked Completed, comparing revenue with actual costs and payments to show the true profit of each tour.
- Supplier Performance for the Procurement department, built from the last 12 months of vouchers: confirmation rate, average days to confirm, unconfirmed vouchers beyond threshold, cancellation waivers, bookings and spend per hotel.
- A Rate Coverage grid of hotel by month for the next 12 months, where red marks a month a live costing needs but no rate covers.
- Travel agent performance stats grouped by company, and Transport KPI tiles for new requests, unassigned tours starting within 7 days, tours on the road today and tours awaiting closure.
- Selling prices, invoices and financial KPIs in USD, with costs and payables in LKR, matching how a Sri Lankan DMC actually trades.
Ask Jarvis the follow-up question
Structured reports answer the standing questions; the follow-up questions they raise rarely fit a pre-built chart. Jarvis, the in-app assistant, answers questions about your own bookings and operations in plain language, such as which confirmed bookings arrive this month or which bookings from a given agent were never confirmed. It also answers analytics questions, such as the conversion rate this quarter, which agent has the most bookings or revenue trends for the last six months, with numbers that cover the bookings the user handles.
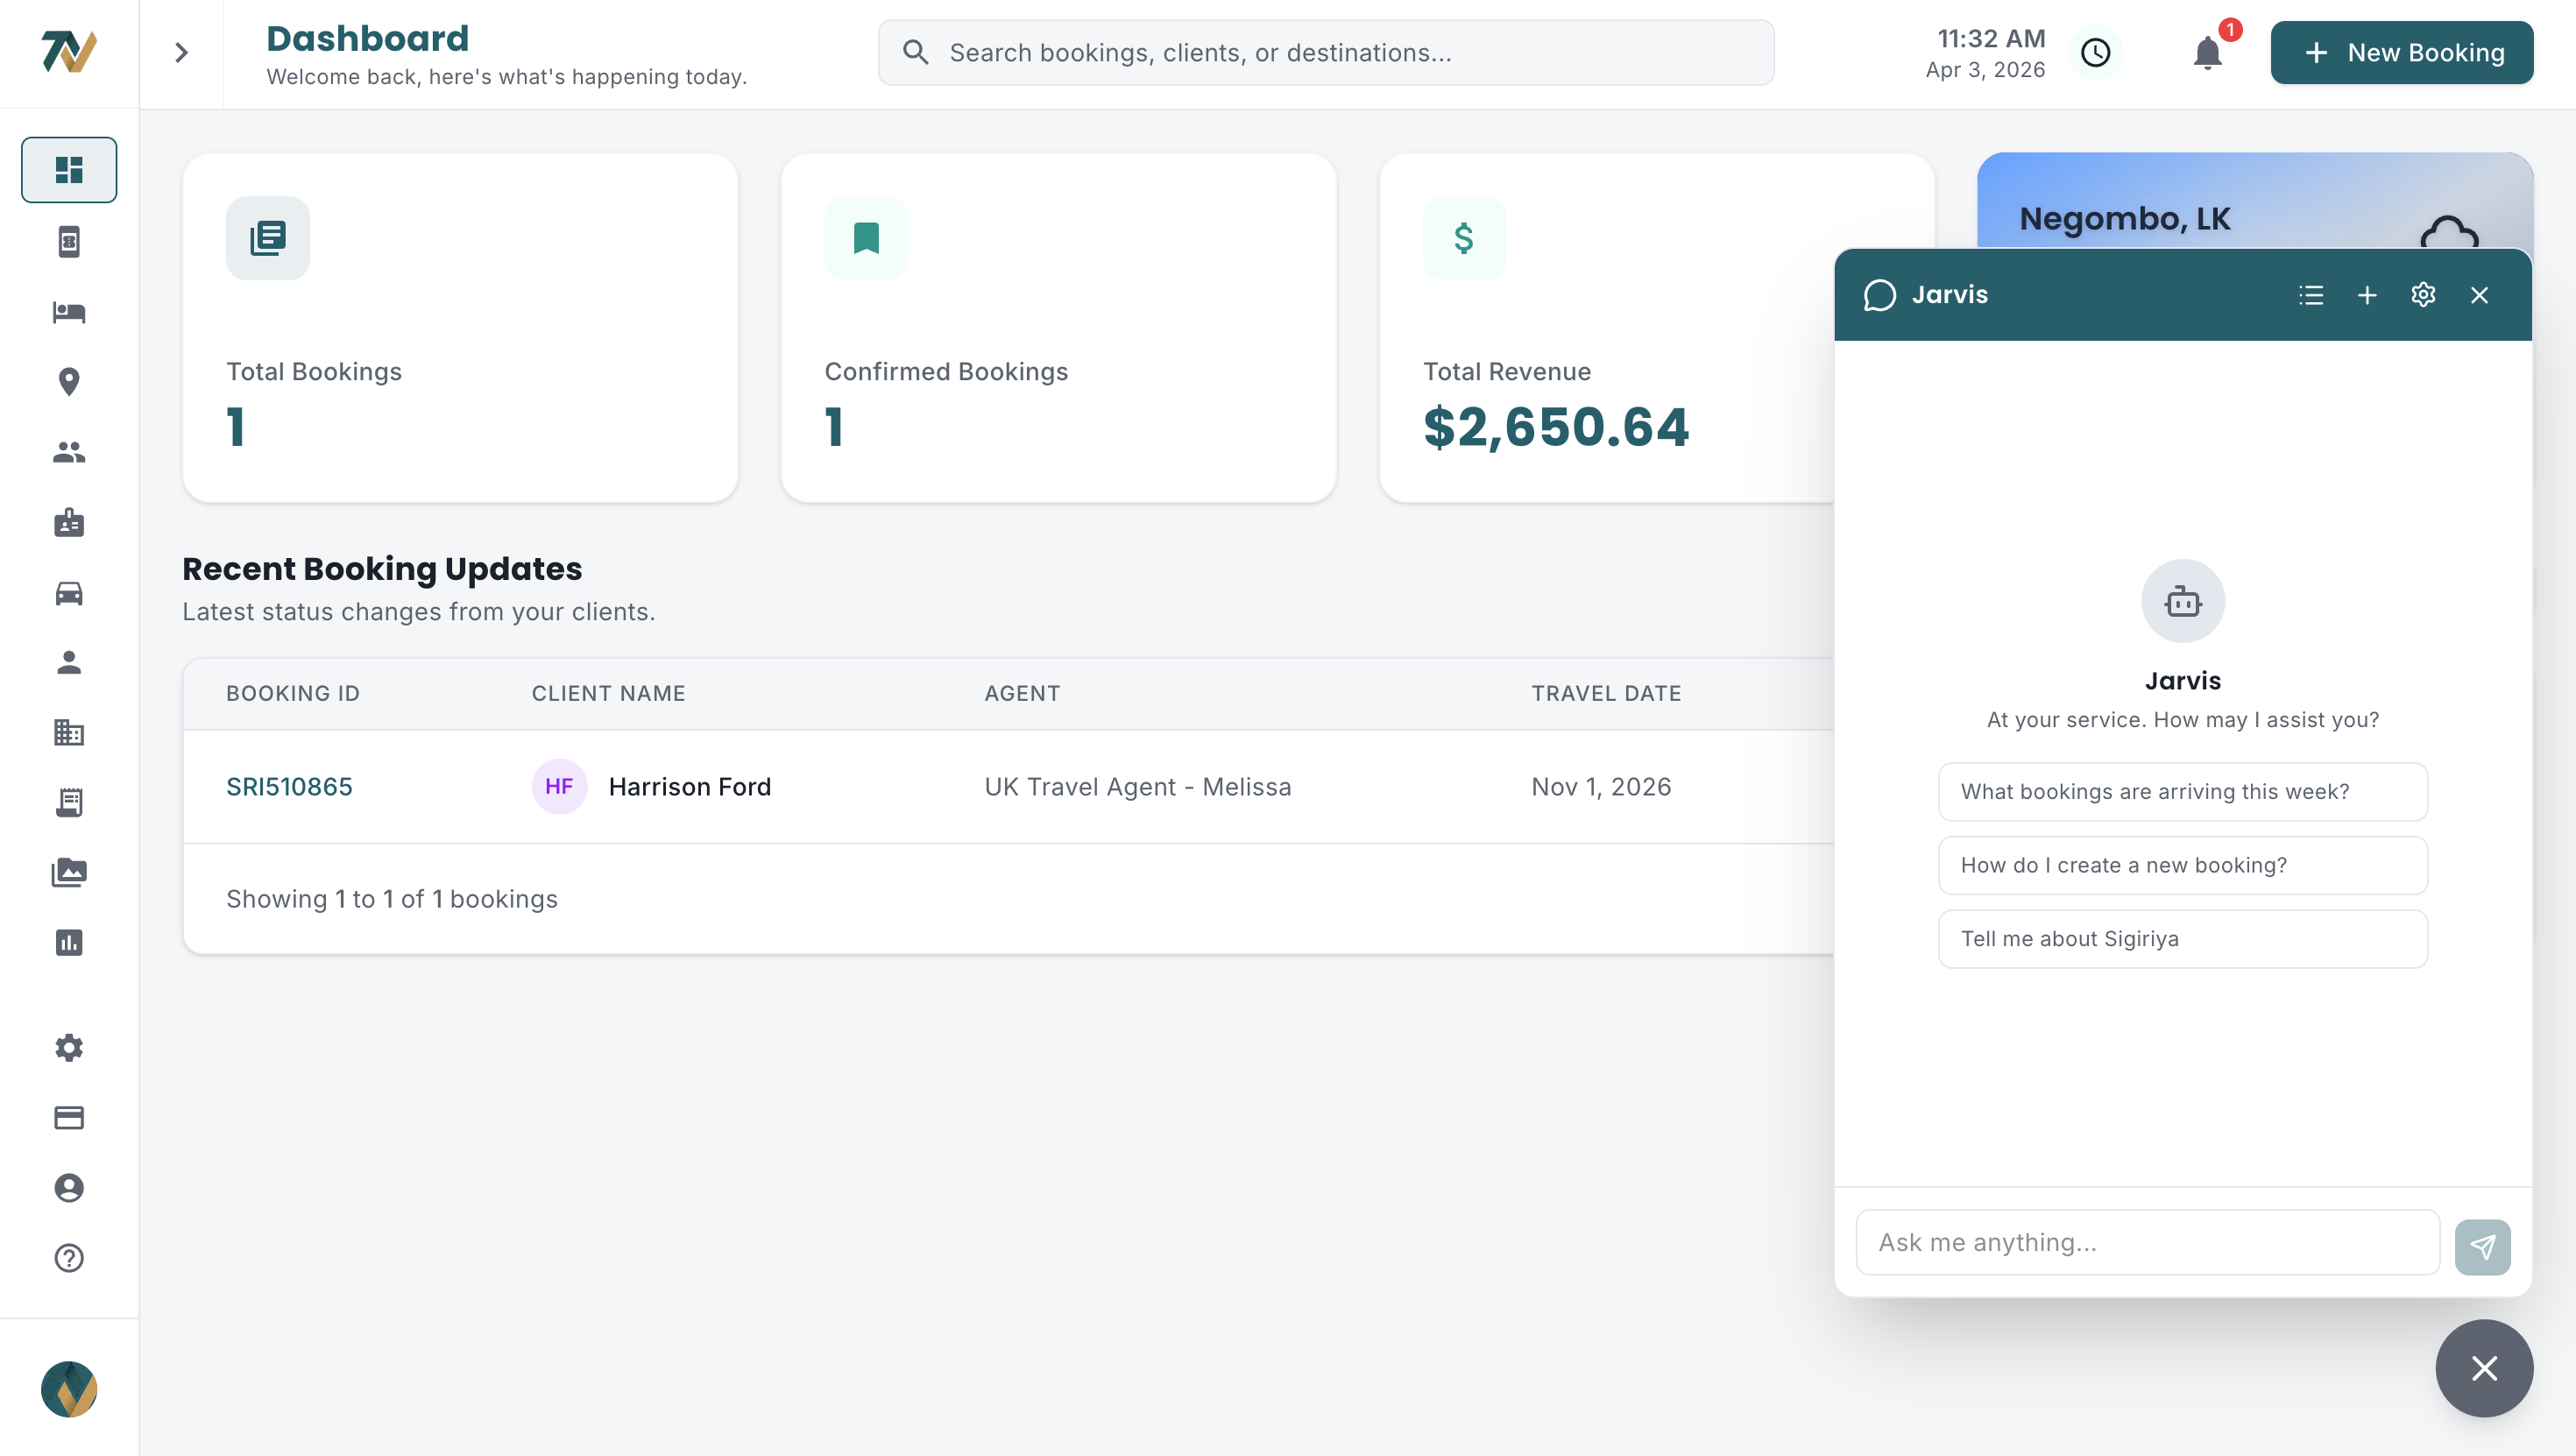
Regular reports for monitoring plus an assistant for ad-hoc investigation give a tour operator full analytical coverage without technical skills. Reports are part of the platform rather than an add-on; see Travify plans, each of which starts with a free trial.
See your business clearly
Stop guessing and start knowing. Travify reports give you visibility into bookings, revenue, agents, hotels, finances and customers, generated automatically from your operational data.
Start your free trialarrow_forwardFrequently asked questions
Ready to Streamline Your Operations?
Join Sri Lankan travel companies already saving hours every week with Travify.
Related Articles
Tour Settlement and Profit Tracking for Sri Lankan DMCs
You quoted a healthy margin on a 10-day tour, but once the supplier invoices arrived the earned margin was lower. Per-booking settlement shows exactly which cost line took the difference.

B2B Travel Agent Management for Sri Lankan DMCs
India sent about 531,000 visitors to Sri Lanka in 2025 and the UK grew 24.9%. Behind those arrivals are travel agents. Here is how a DMC tracks, pays and keeps them.
How to Scale a Tour Operation from 10 to 100 Bookings a Month
Manual processes that work at 10 bookings a month break at 20, 40 and 80. Here is where Sri Lankan DMCs hit the wall, the six systems that get them past it, and a realistic rollout order.